Guides → WiFi LED Air Quality Display
WiFi LED Air Quality Display
Keep an eye on the air outside — your city’s current air quality index on the panel, refreshed over Wi-Fi, next to everything else you rotate through.
What you need
- A DataPix, powered on and joined to your Wi-Fi (see Setup).
- A free OpenWeatherMap API key — the same one the Weather preset uses.
Step by step
-
Open the interface
From a browser on the same network, open the device's IP address shown on the panel.
-
New view → Air Quality
Go to Views → New view and pick the Air Quality preset.
-
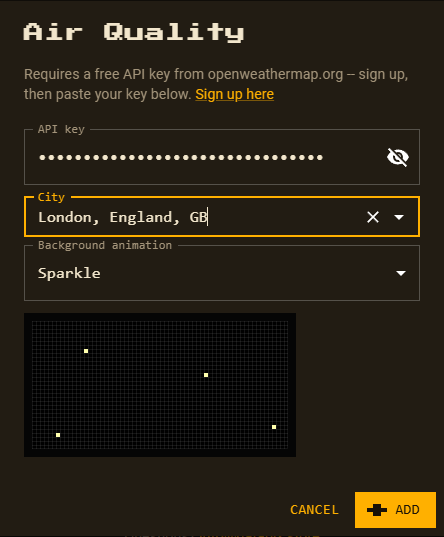
Paste your key and search a city
Paste your OpenWeatherMap key, then type the city and pick the matching result.
-
Pick a background animation
Sparkle is preselected; choose any of the 14 animated patterns or 26 full-panel effects, or None. A live preview plays right under the dropdown. Subtle patterns keep text easiest to read.
-
Customize and save
Click Add. The city name and the live
AQIreading are separate, movable values. A long city name starts out scrolling sideways on its own — shorten it to fit if you prefer, then Save.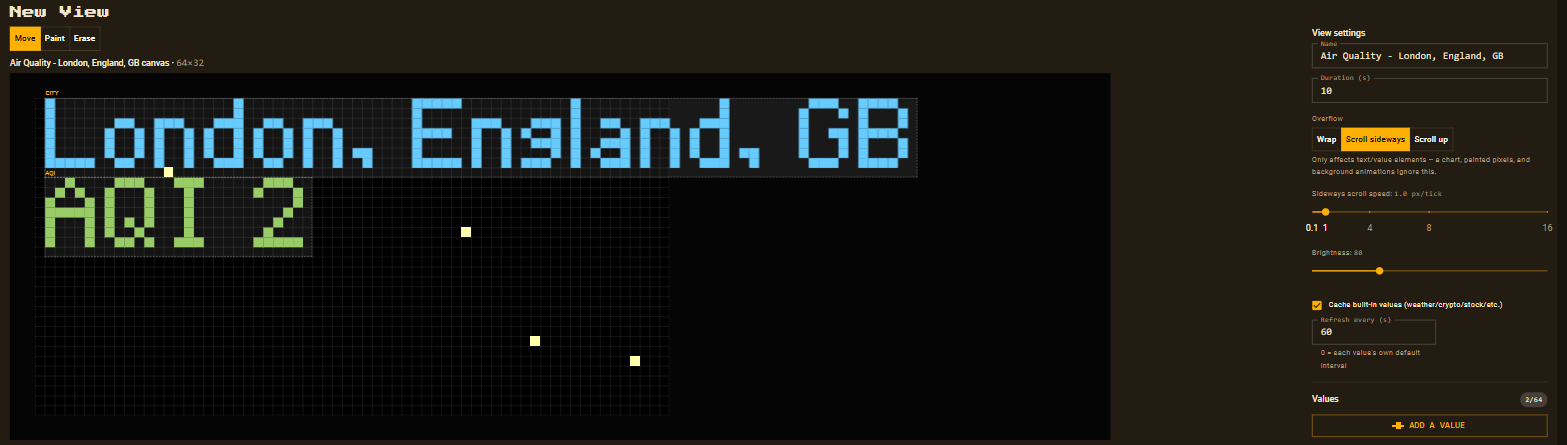
Reading the number
The panel shows OpenWeatherMap’s index as AQI 1 to AQI 5:
| AQI | Meaning |
|---|---|
| 1 | Good |
| 2 | Fair |
| 3 | Moderate |
| 4 | Poor |
| 5 | Very poor |
Want it to turn red on a bad day? Select the AQI value in the editor and use Color by value — a different colour below or above a threshold you pick (e.g. above 3).