Guides → Custom View: Any JSON API
Custom View: Wire Up Any JSON API
Every guided preset — Crypto, Stocks, Weather — is really just a Custom view with the API already filled in. This guide shows the raw mechanics so you can point DataPix at any API that returns JSON: your own server, a smart-home hub, a project tracker, anything. We'll use JSONPlaceholder, a free public test API that needs no key or sign-up, as a worked example.
The example endpoint
https://jsonplaceholder.typicode.com/users/1 returns a single
user as plain JSON:
{
  "id": 1,
  "name": "Leanne Graham",
  "username": "Bret",
  "email": "[email protected]",
  "address": {
    "street": "Kulas Light",
    "city": "Gwenborough",
    ...
  },
  "phone": "1-770-736-8031 x56442",
  "website": "hildegard.org",
  "company": {
    "name": "Romaguera-Crona",
    ...
  }
}
Any of these fields — name, email,
address.city, company.name, and so on — can
become its own element on the panel, styled and positioned independently.
What you need
Step by step
-
Open the interface and start a Custom view
From a browser on the same network, open the device's IP address, then go to Views → New view → Custom for a blank canvas.

-
Add a value from an API
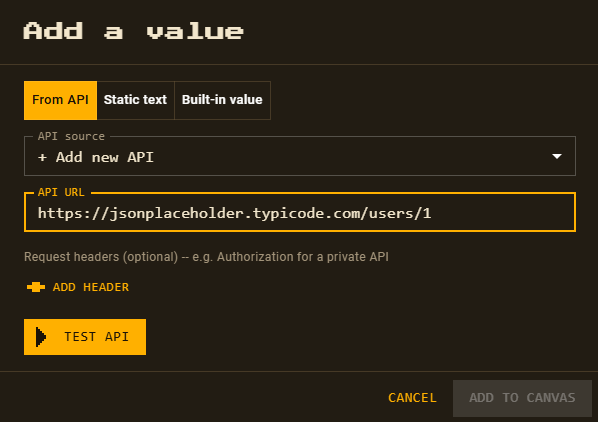
Click Add a value, keep the From API tab selected, and paste the endpoint URL. There's no key needed for this example.
-
Test the API
Click Test API to fetch a live sample. Every field in the response appears as an expandable, checkable tree — on a real DataPix testing this URL, that tree shows
id,name,username,email,address.city,phone,websiteandcompany.name.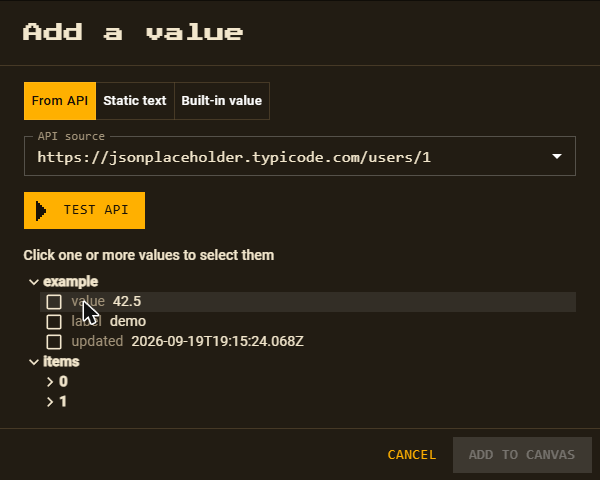
The screenshot above is from the interface demo, which simulates a response locally rather than making a real network call — that's why its field names don't match JSONPlaceholder's. Tap a real device's Test API button against this URL and the tree matches the real payload shown above.
-
Pick fields and add them to the canvas
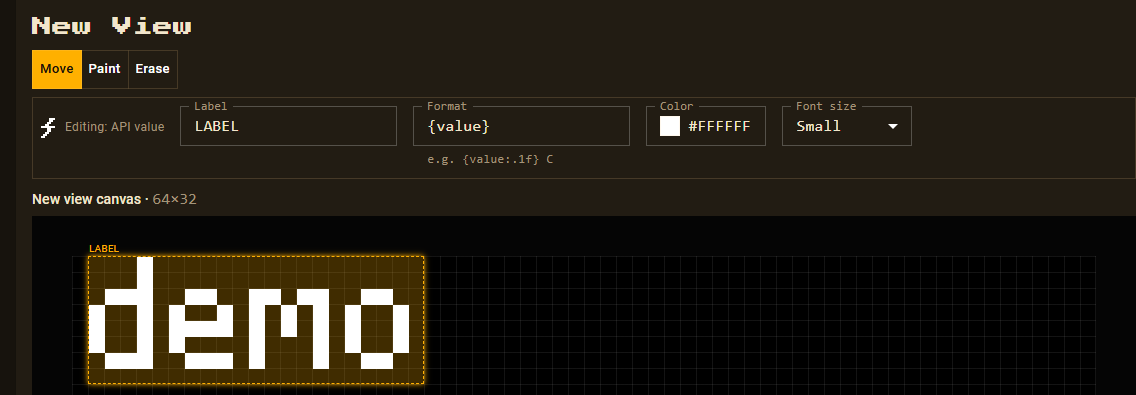
Tick one or more fields — picking several at once adds them all as separate elements in a single step — then click Add to Canvas.
-
Position, format and save
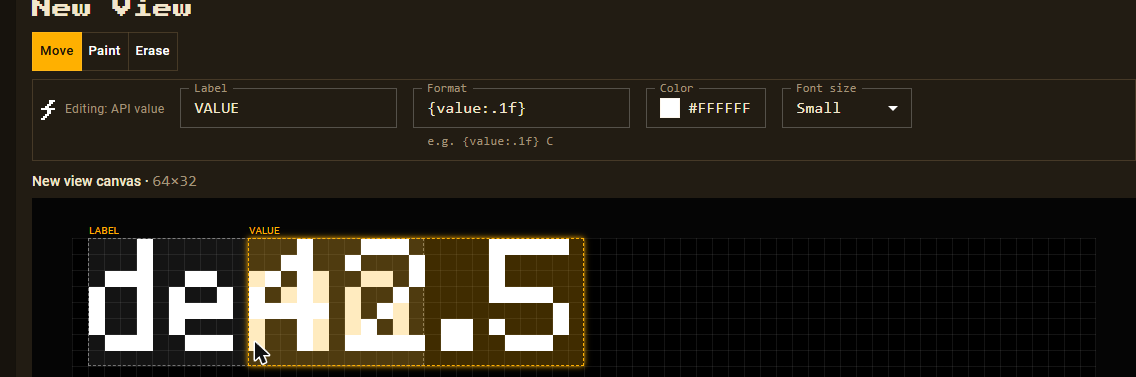
Drag each value into place, and use a format string like
{value:.1f}to control decimal places, or wrap it with your own text. Adding a second value from the same endpoint doesn't need re-testing — pick the saved source from the dropdown.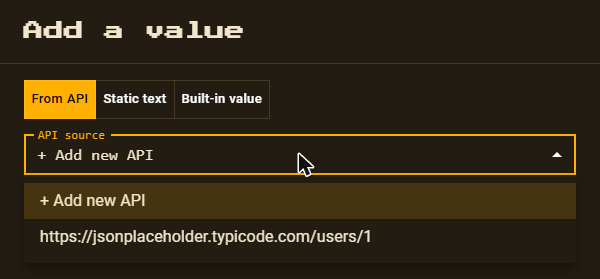
When everything's positioned, click Save View.